Vancouver, you just saw a record-breaking September
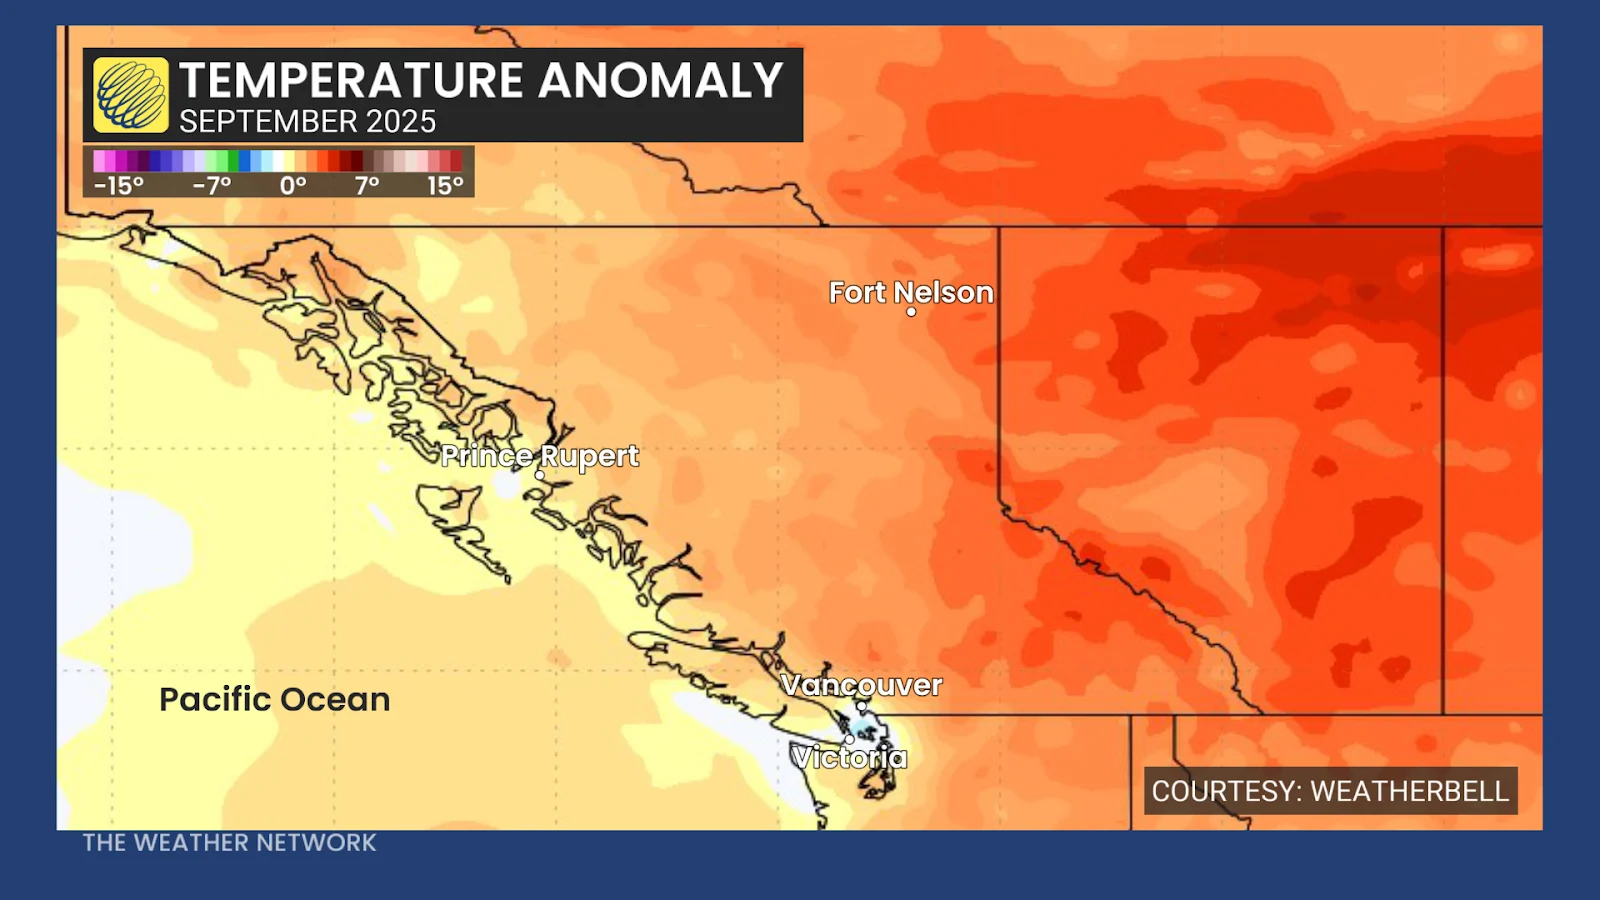
Average mean temperatures came in significantly above normal for the month of September
September is in the books as the warmest on record in Vancouver thanks to a combination of warm daytime highs and unusually elevated nighttime lows.
An unseasonable pattern that dominated the West Coast for much of the month helped keep warm air locked in place over the region.
DON’T MISS: ‘Striking’: Global oceans are warming fastest in two specific regions
Vancouver’s warmest September on record
The first month of meteorological autumn felt more like an extension of late summer across Vancouver as temperatures remained unusually warm for this time of year.

Vancouver’s average daily mean temperature—which factors together the day’s high and low temperature—for the month came in at almost 17°C.
This makes September the city’s warmest on record, coming in around one-and-a-half degrees above seasonal compared to climate normals between 1991 and 2020.
The city typically notches around ten September days with high temperatures at or above 20°C. We saw significantly more than that this past month, including almost every day through the first half of September.
Canada's October wild card: Record warmth on the table, but snow still in play
But it wasn’t just unseasonably comfortable days that drove the month’s record warmth. Temperatures remained elevated at night, as well, largely due to the moderating effects of the Pacific.
September’s average minimum temperature came in at 13.4°C in Vancouver, which is more than two degrees warmer than normal. Several days in the first week of the month saw overnight lows remain at or above 15°C.
Climate change making nights warmer
Temperature records rarely register when they’re rather comfortable. However, it’s important to note that warming nights are a major consequence of global climate change.
How noticeable is the change over time? Take the average number of chilly nights each year as an example.
Between 1971 and 2000, Vancouver averaged 45.9 days per year with low temperatures at or below freezing, and 78.6 days each year with low temperatures at or below 2°C.
According to the current set of climate normals, which runs from 1991 to 2020, those values have slipped down to 39.8 days per year with lows at or below freezing, and just 70.8 annual days with lows at or below 2°C.